Our team is expanding our geospatial damage assessment capabilities with a machine learning (ML) model to automatically detect a variety of objects in RGB imagery. Throughout
our four-decade partnership with FEMA performing geospatial damage assessments, we’ve learned that by identifying downed trees, debris in pools, and tarps covering rooftops, we can develop a deeper understanding of the areas most impacted after
a storm and how to effectively allocate recovery efforts.
Downed trees indicate areas that may qualify for recovery programs that pay for tree stump removal. A neighborhood with tarps covering a number of roofs indicates communities that may need housing assistance. Pools that are full of debris could indicate
areas to send debris removal equipment and another indicator of damages. When put together, this type of information allows decision makers to understand the hardest hit areas of a community, thereby speeding up the process to direct resources where
they are most needed. It also helps local governments understand what types of assistance programs may be most beneficial to their communities.
The model will give better situational awareness of the impacted areas. When combined with our existing machine learning model to classify structure damage impacts, the emergency management community will be able to make more informed decisions for response
and recovery efforts. ”
Ian Byers
Training Data
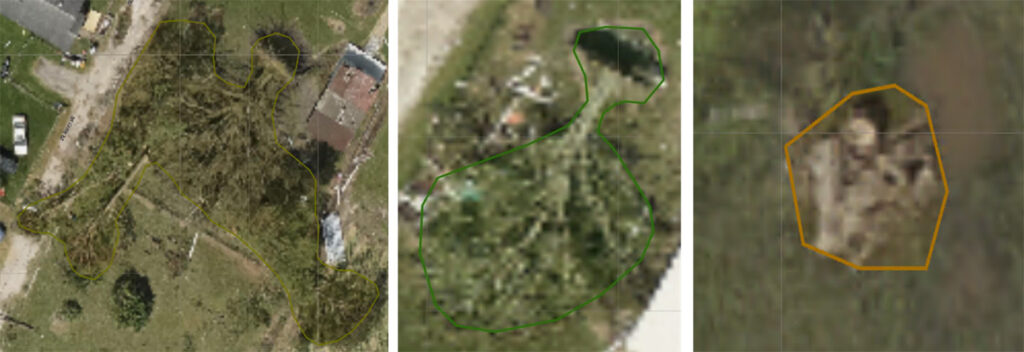
In order to automatically detect objects such as downed trees, tarps, and pools filled with debris, we needed to train a ML model to learn to detect these items in images. Using recent National Oceanic and Atmospheric Administration (NOAA) emergency response
and Civil Air Patrol imagery from Hurricane Ida, we annotated these three items into labels. We further trained the model to identify sub-labels, such as stumps, individual downed trees, and groups of downed trees.
After creating thousands of examples for each class, we successfully trained data to begin developing a ML model to detect these items. A workflow was added to the model to further train data, improve detection performance, and add new imagery sources
and geographies.
Model Development Strategy and Deployment
With the ML model trained, we moved to the development stage. In this stage, we are building a semantic segmentation model to determine which pixels in the imagery are downed trees, tarps, pools, or none of the above. This is an iterative process which
can take weeks of experimentation to find the best model architecture, hyper parameters, and model performance validation. An important part of measuring effectiveness of a model is having a test dataset that represents what it will look like after
a disaster. This can be done by withholding a portion of the test dataset and then testing multiple models or hyper parameters until satisfied with the results. We then deploy the model and inferencing workflow into a cloud or production environment.
Once the development stage is complete, the ML model will be ready for deployment. We will use this model in combination with existing damage assessment processes that will provide emergency managers with additional information to implement faster results.
About the Author