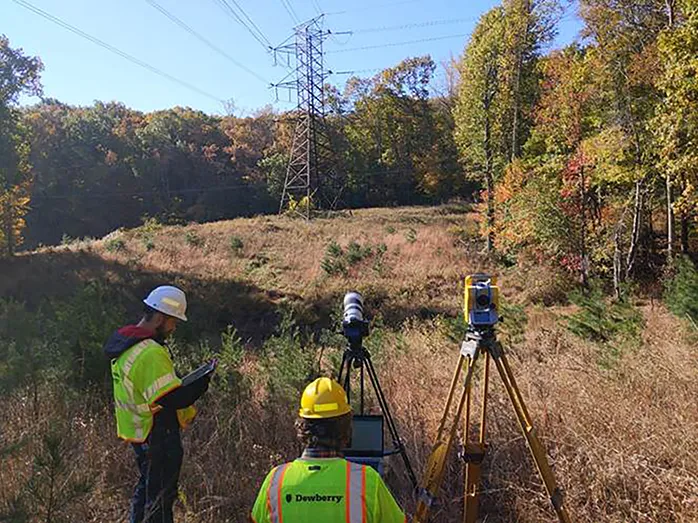
The Brighton Dam was built in 1944 along the Patuxent River between Montgomery and Howard counties, Maryland. The 1,000-foot dam created the Triadelphia Reservoir, which holds around 6.3 billion gallons of source drinking water for Washington Suburban
Sanitary Commission (WSSC) customers in Montgomery and Prince George’s counties.
Our client is under contract to replace the concrete on 13 spillways. Concrete removal is accomplished by hydroblasting in order to replace the spillway surface. One of the concerns was how to calculate how much concrete was actually being removed, since
the hydroblasting machine is based on pressure and existing conditions, we had to find a way to quantify how much concrete was actually removed. If it’s “dead” concrete, more comes off during the hydroblast operation, while less
concrete will come off if it’s good, solid concrete.
Once we understood what the client needed, we determined that scanning would be the best way to capture the data needed to compute the volumes. We scanned each spillway before concrete removal and then scanned the spillways again after the removal to
determine the volume of concrete removed. The process is complicated because of the 150% slope and curvature of the spillway. Our civil software gives vertical differences and in this particular case we needed perpendicular distances to calculate
removal depths.
Specialized Scanning
Another challenge we faced with this project was how to scan a 50-foot-tall spillway and see the top of the crest at the sluice gate. We determined the best way was by inverting the scanner over the railing at the top. A specialized mount was created
in order to invert the scanner to obtain scans at the sluice gate sill plate and to see over the spillway where each sluice gate closes.
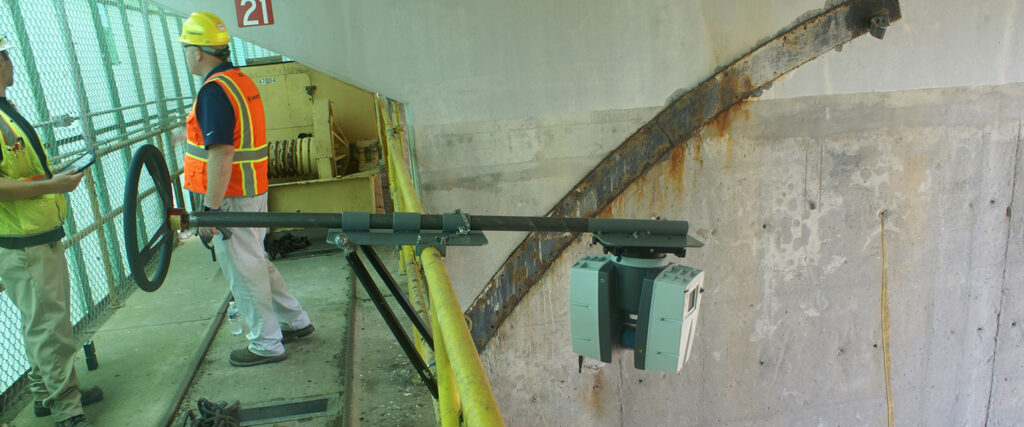
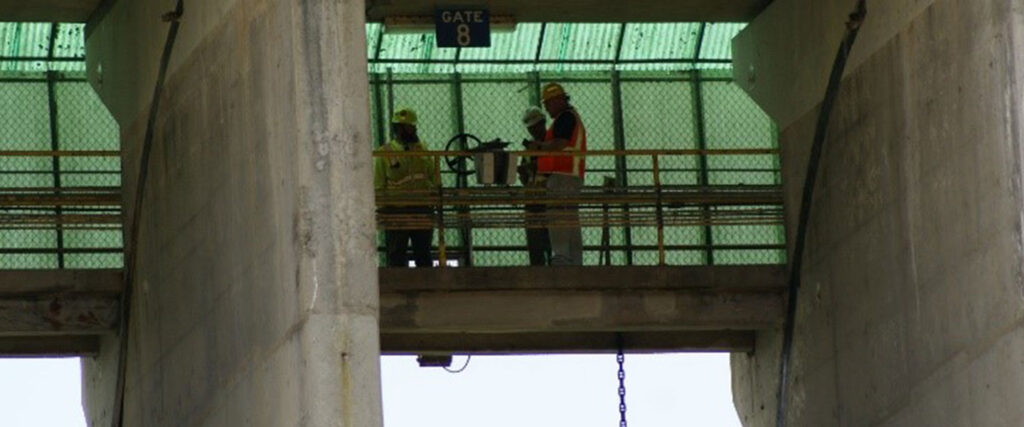
The best way to scan the full 50-foot spillway was to invert the scanner at the top of the spillway.
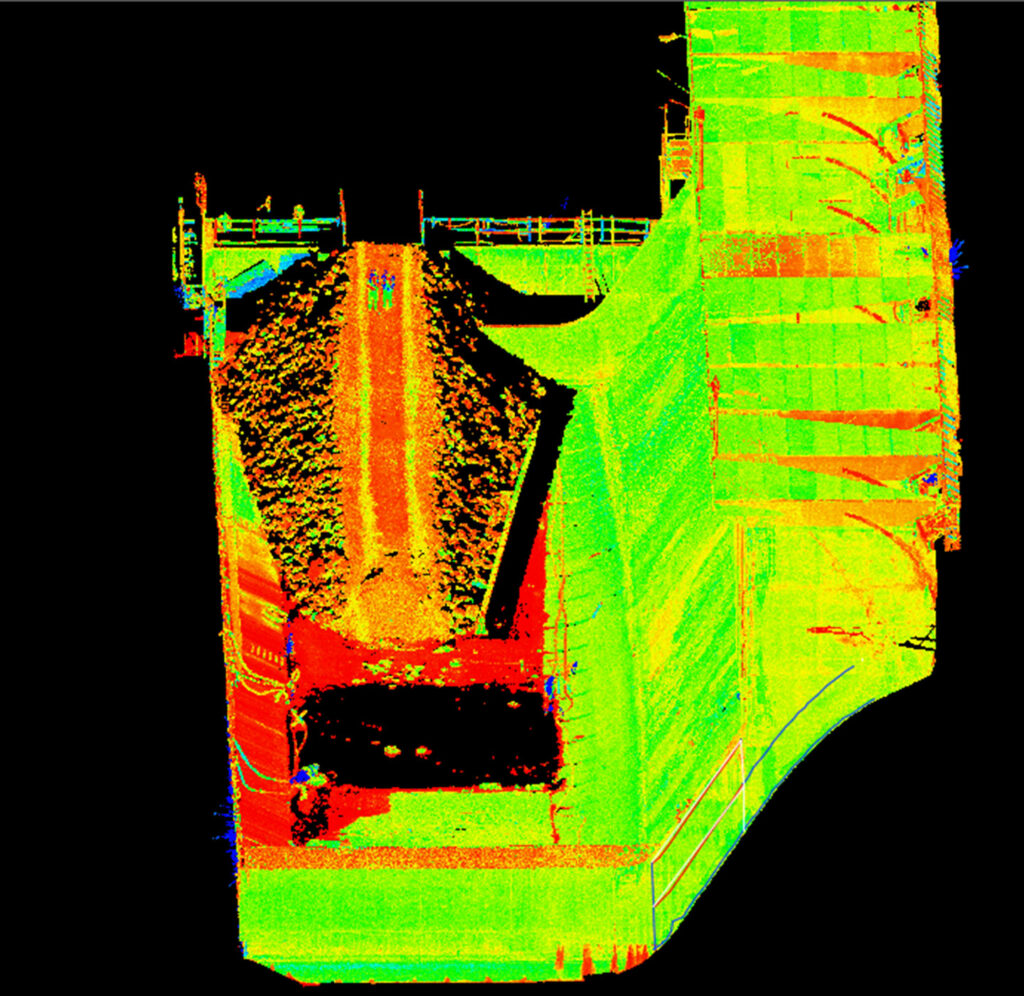
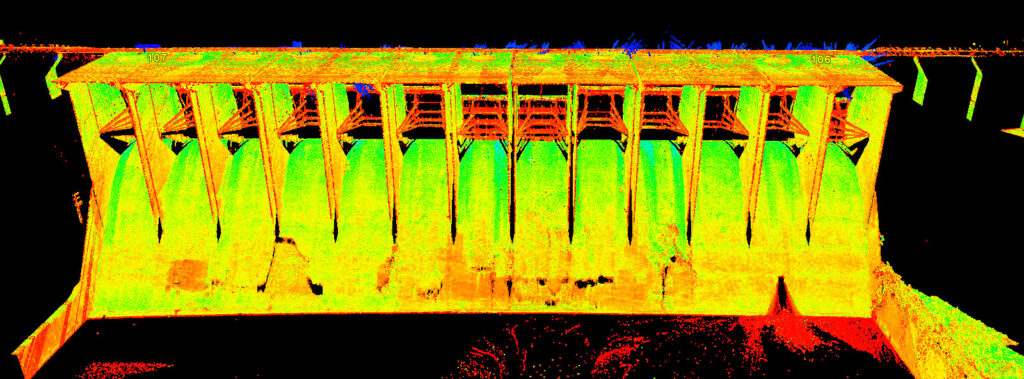
The scans provided an in-depth look at the concrete and the existing condition of each spillway.
The biggest challenge with this project was scanning the entire spillway accurately. Having the scanner mounted inverted allowed us to accurately scan the entire spillway and sluice gate in one single scan.
The project also took a lot of coordination with the construction team. During the hydroblasting process for the face of the spillways, the owner was concerned that the remaining concrete may be too thin and potentially compromised. We then provided scans
of the inside slabs at each spillway of the dam to determine the thickness, so the construction team could calculate how much new concrete could be poured without compromising the existing slabs.
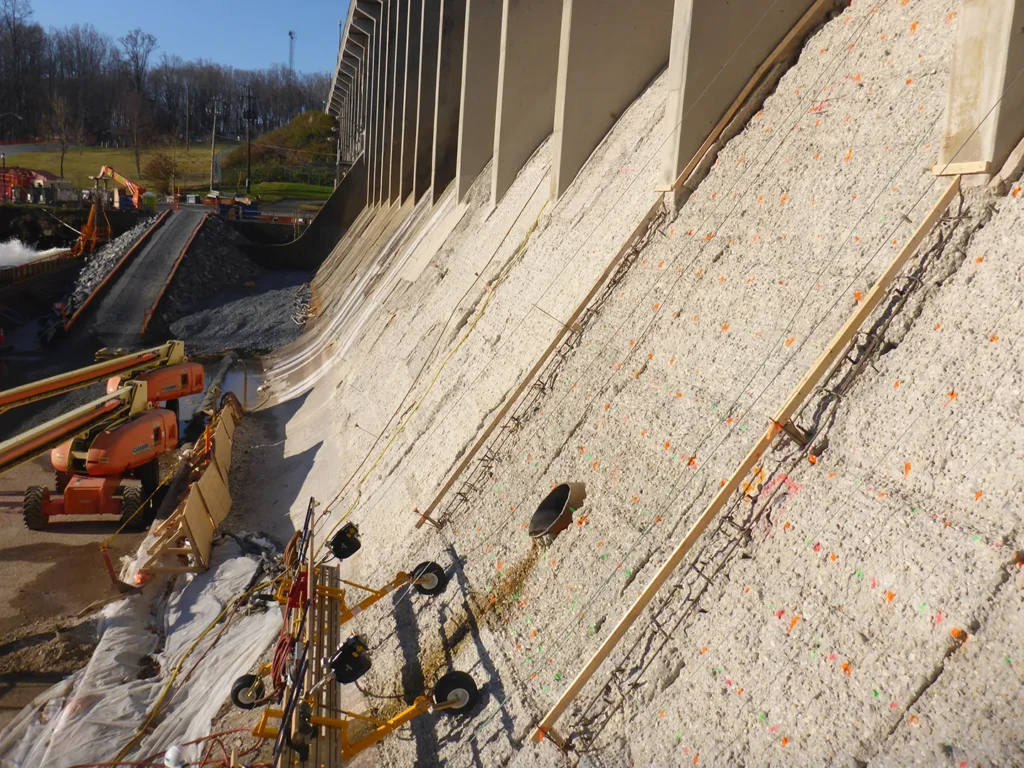
The spillway after the hydroblasting process. From the scans we were able to determine the amount of concrete removed.
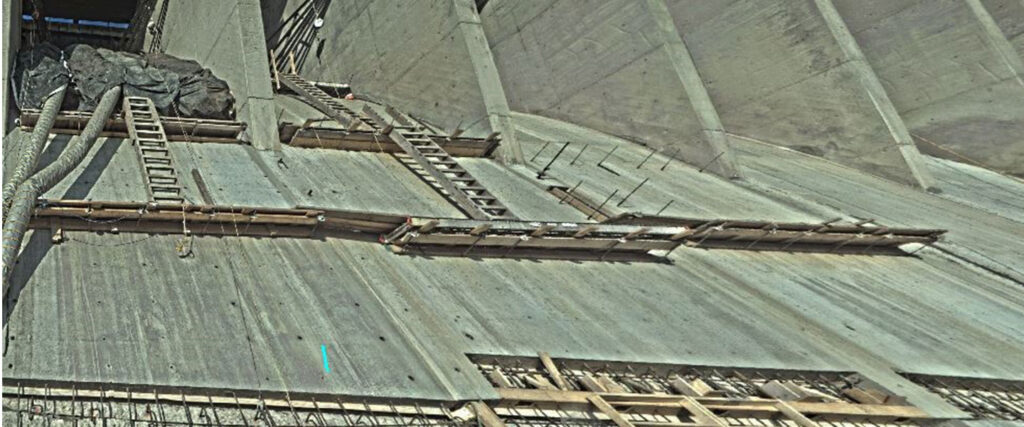
The new spillway surface will increase the efficiency of the water flow.
Successful Scanning
We were successful in completing the scans in the field and processing the data for our client to use throughout the project. They are utilizing our reports and prepared exhibits to document their quantities and overall progress. The scans show pre-construction
existing conditions, and the detail gathered after scanning for each bay post-hydroblast.
We used the latest Cyclone software to process the scan data. We used Carlson to run volumes and create the deliverable. One of our favorite parts of this project was the challenge of figuring out how to explain the data in a way the client could understand,
and we were successful in doing that. Work is still underway on resurfacing the dam and is expected to be completed in 2019.
About the Authors

Joseph Agenbroad