In 1933, Gov. Wilbur L. Cross requested that Connecticut conduct a photographic aerial survey of the state—the first government-sponsored statewide aerial survey in U.S.
history. The images taken in the survey were used to inform the state’s
health, highway, tax, and water departments as they planned for future
development and funding. Image collection took two months, and it took an
additional year to piece the photos together.
Now, over 90 years later, our team is doing almost the
exact same thing, though modern technology allows these surveys to capture much
more detail than they did in 1933. These days, aerial surveys are a common tool
that states use for mapping, resource planning, engineering, land use planning,
and agricultural monitoring.
Aerial Mapping Today
In a 2023 survey, our
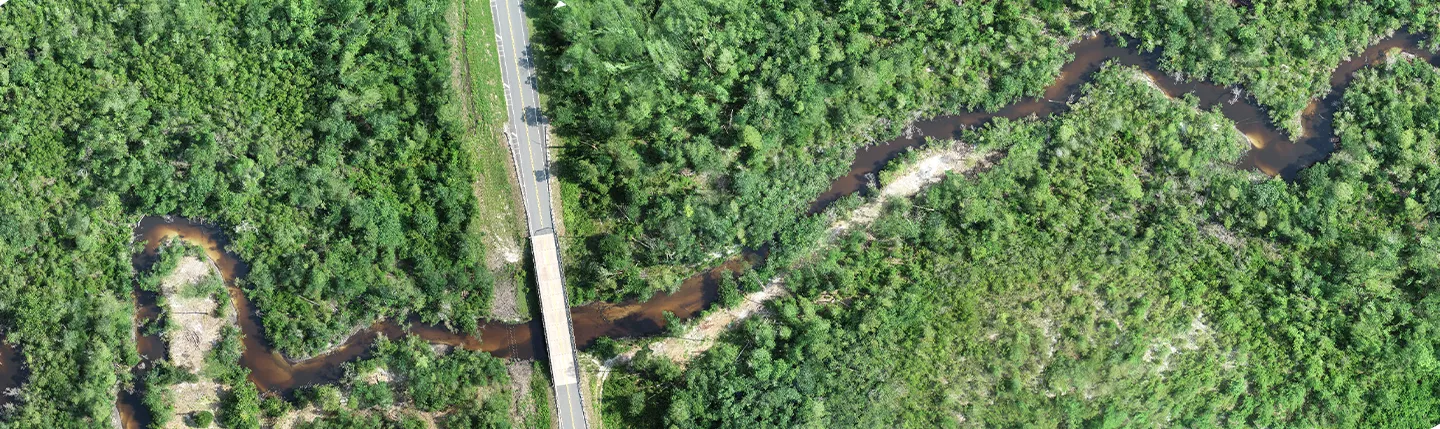
team gathered high-resolution elevation data, high-resolution aerial photography,
and lidar data for the Connecticut Office
of Policy and Management (OPM). The aerial photography was taken at a three-inch
resolution, meaning any detail on the ground within three inches is identified
on the image, while the coastal zone’s lidar data was captured at a density of 20 points per square meter—the highest
density ever used in a state survey.
Now, our team is preparing to map Connecticut again. With
flights scheduled for the spring of 2026, Connecticut will be the first state
to possess two high-quality data sets of this density that share the exact same
specifications.Andrew Peters
With the only variable being time, the high-resolution data
from both 2023 and 2026 will provide the state with a direct comparison of
its topography and how it has changed over the course of three years,
allowing for more informed and timely decisions on agriculture, environment,
planning, and infrastructure.
Benefits to the State
This data is especially important to the infrastructure
and development of the state. The inland lidar data can be used to establish a
statewide building database, allowing the state to identify existing
infrastructure and track land use changes over the years, such as differences
in urban, agricultural, or suburban use. This works with impervious surface
modeling will address conservational concerns like increased storm water runoff
from higher levels of land development.
The coastal zones data is beneficial as the state
monitors sea level rise and tidal conditions in the Connecticut River and the
coastline. The data will be used to monitor flooding and supplement
many hydrological studies and water data modeling.
The data can also be used in emergency response plans for
officials to see a building’s location and elevation to better accommodate
emergency vehicles.
Challenges
In order to get accurate data, our team must survey when
there is no snow on the ground and no leaves on the trees. Connecticut’s early
spring can make that a difficult task. For our 2023 survey, spring weather came
nearly 25 days early, resulting in the trees blooming early. To overcome this
challenge, we mobilized sensors early and undertook multiple flights out at
once. There were even instances where flights were safely crossing each other’s paths while they took photos. As we prepare to take flight again next spring,
we have a better understanding of the climate ahead. This foresight for our
2026 survey will allow our team to collect calculated, thorough data for the
state and in future mapping projects.
Extended Impact
Since completing our 2023 survey, we have not only
recognized our data’s impact for Connecticut’s OPM, but also for other agencies
and clients within the state. Connecticut’s State Historic Preservation Office
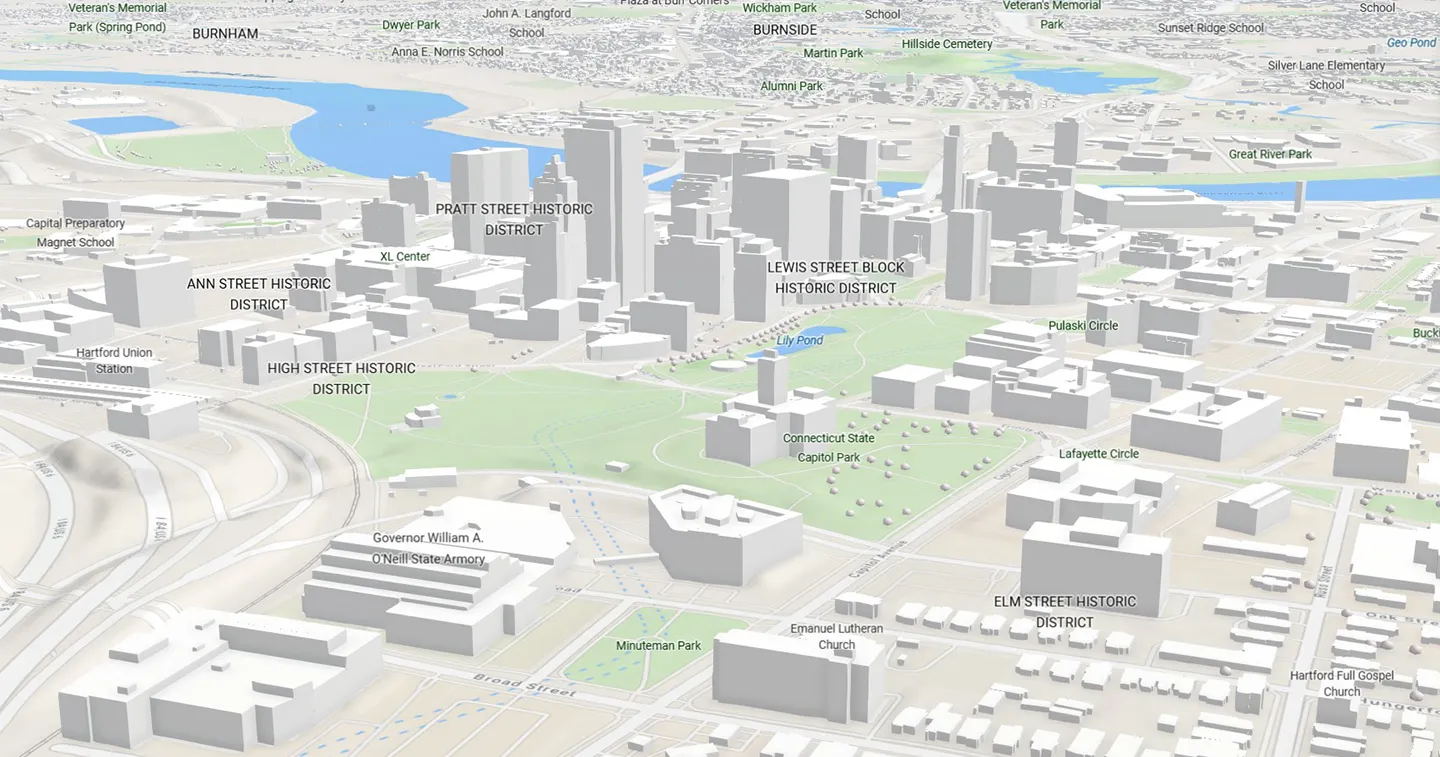
(SHPO) is using the collected data, specifically the digitized representations
of historic buildings, to organize its preservation efforts. Before the 2023
aerial mapping data, the Connecticut SHPO did not have accurate 3D models. Now,
it can zoom into a 3D data set to identify and register historic buildings
and better protect Connecticut’s cultural heritage.
Additionally, once the data from our 2026 survey is
processed, the state of Connecticut will have access to an accurate depiction
of the current topography and be able to compare it to our 2023 survey, allowing
project teams to see how any implemented changes following the first survey
have taken effect as well as recognize problem areas that could require further
attention.
To see more from our 2023 survey, dive into this live scene viewer via ArcGIS.
About the Author