NOAA Supplemental Sandy Topobathymetric Lidar and Imagery Mapping
NOAA Shoreline Maps Updated from Myrtle Beach to Long Island
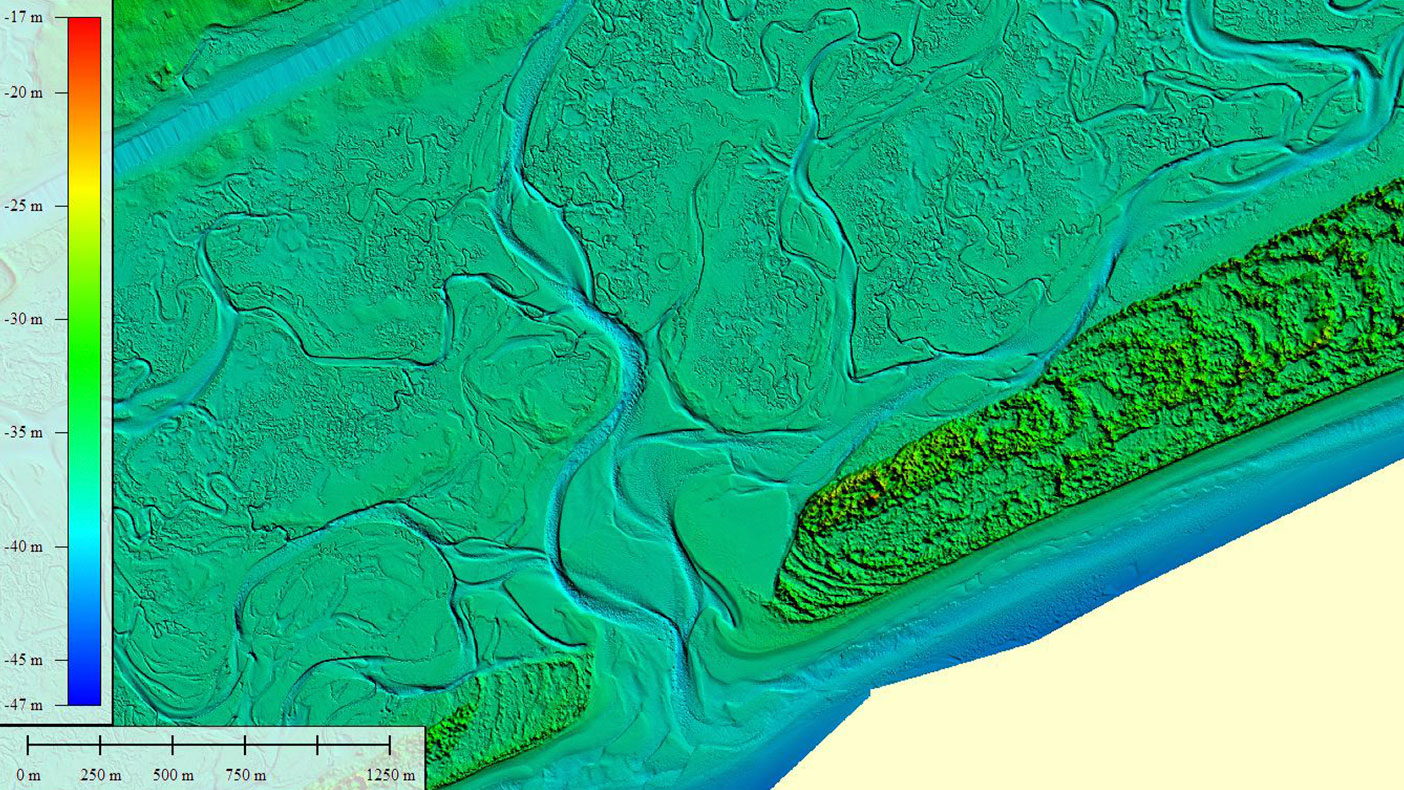
We developed a method using ECognition and ArcGIS to automate breakline definition of the land/water interface. An image of Bear Inlet, North Carolina, is color coded for elevation (ranging from -17 to -47m) based on an ellipsoid datum.
- Owner/Client
- National Oceanic & Atmospheric Administration
- Location
- Nationwide
- Linear Mileage
- 1,200 LM
- Cost
- $10 million
- Completed
- 2015
- Regions
- Southeast, Northeast, Mid-Atlantic
We acted as the prime consultant for a large-scale mapping initiative through our coastal and geospatial services contract with the National Oceanic Atmospheric Administration (NOAA). The initiative updated 1,200 linear miles of shoreline data that will be used by NOAA to enable accurate and consistent measurement of the national shoreline following Superstorm Sandy’s landfall in September 2012. The updates provide tide-coordinated seamless topobathymetric lidar data and imagery that will support mapping, charting geodesy services, marine debris surveys, and coastal shoreline modeling for states impacted by Superstorm Sandy. This shoreline data has also been applied to nautical charts and is considered authoritative when determining the official shoreline for the U.S.
We have overseen data acquisition, conducted data processing, quality control, data merging, shoreline mapping, and completed product delivery. We developed new methods for processing these unique data and new lidar processing software to perform refraction correction. The new methodologies and software were shared with our subconsultants and NOAA.
32,000+
flight line miles
304
flight missions
60+
TB of data
Awards
-
LCDR Peter Johnson Best Practices Award
Joint Airborne Lidar Bathymetry Technical Center of Expertise and NOAA
Related Projects
- Location
- Currituck County, NC

- Location
- Nationwide
- Location
- Prince George's County, MD

- Location
- Brooklyn, NY